 The first month of GSoC has ended and I have completed my first evaluations.Gladly, I passed my first evaluations with good remarks. Thanks to my mentor, Mr.Adam Morris.
It has been a fun time working on this project. Adam gave me a list of bugs which made me familiar with different visualizers of Yellowbrick. Mr. Larry Gray, one of the core contributor of Yellowbrick, also helped me through this. Apart from this, I started working on Data Visualizer. It is one of the initial steps towards creating a Projection Visualizer. Let us go through these in details.
The first month of GSoC has ended and I have completed my first evaluations.Gladly, I passed my first evaluations with good remarks. Thanks to my mentor, Mr.Adam Morris.
It has been a fun time working on this project. Adam gave me a list of bugs which made me familiar with different visualizers of Yellowbrick. Mr. Larry Gray, one of the core contributor of Yellowbrick, also helped me through this. Apart from this, I started working on Data Visualizer. It is one of the initial steps towards creating a Projection Visualizer. Let us go through these in details.
Bug List:
The bug list involved pretty diverse visualizer of library. It dealt with regressors, classification, and feature analysis visualizers. I also dealt with base functionality from the base class.
Bug 1: Poof does not produce an image when called in a different cell. I was expected to explore this issue and come up with possible solutions. The comments on the issue were quite helpful. And after a few hours of research I came up with a possibility to deal with these here. I also created a couple of Jupyter notebooks demonstrating usage of both of my methods.
Bug 2: Parallel Coordinate and Radviz do not provide support for non-label encoded targets. This a recurring problem with the classification problems. Suppose we have classes [‘a’, ‘b’, ‘c ’] and target is [0,1, 2]. Now to iterate through classes based on the target we can do [classes[yi] for yi in y]. But if the target is not label encoded like [0, 10, 20] then we bump into an index out of bounds error. This error needs to be fixed but for now, support for this is not an emergency. In most of the cases, the target is label encoded using traditional label encoders which ensures that target is of the form [0, 1, 2] and not [0, 10, 20]. Hence this was closed. Perhaps, we can open this up if we come through a good example to deal with this
Bug 3: This bug dealt with Discrimination Threshold. This visualizer helps in determining the threshold for classification problems based on various criterions. It achieves so by calculating many arrays of thresholds and other metrics based on thresholds. Now to find the threshold it picks an array of minimum length. The problem arises at this point. If the length of the array is small it leads to local minima and the threshold is not accurate. The method mentioned in the PR suggested combining all threshold array and working on them. I, however, opened a PR related to this with a slightly different approach. The approach guaranteed accuracy up to certain decimal points.
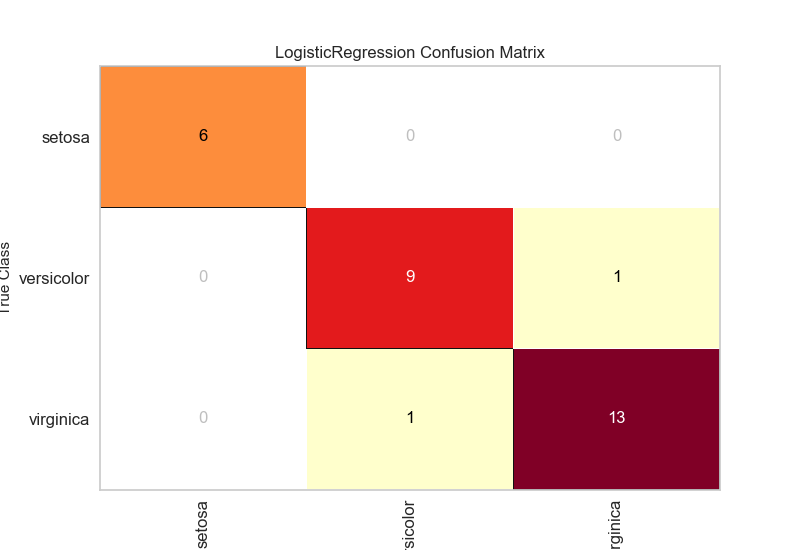
Bug 4: This bug dealt with label cut off in visualizers. When dealing with confusion matrix user may experience labels cut off, shown below.
 To deal with these Mr. Larry Gray came up with a great solution, but it still has some short comings. The method fixed label cut off in the saved images but it errors still shows up for the rendered images. Few possible solutions are mentioned here.
Projection Visualizer:
Currently, Yellowbrick deals with two dimensionality reduction techniques, namely, PCA and Manifold. Both of these have a lot of shared functionality. Projection Visualizer is meant to wrap up the common functionality in a single class and remove the duplicate codes. By using this we will also extend the functionality of both the visualizers. PCA does not support continuous target. Similarly, Manifold does not have support for the three-dimensional plots.
Data Visualizer.
Data Visualizer is a base class which finds classes of targets. This class is meant to provide helper functionality related to target identification whether or not the target is sequential or categorical, and mapping a color sequence or color set to the targets as appropriate. The latter functionality is yet to be implemented. This functionality will prove to be an essential part of both PCA and Manifold. Sample code to provide target identification is provided below:
def _determine_target_color_type(self, y):
        """
        Determines the target color type from the vector y as follows:

            - if y is None: only a single color is used
            - if target is auto: determine if y is continuous or discrete
            - otherwise specify supplied target type

        This property will be used to compute the colors for each point.
        """
        if y is None:
            self._target_color_type = TargetType.SINGLE
        elif self.target_type == TargetType.AUTO:
            self._target_color_type = target_color_type(y)
        else:
            self._target_color_type = TargetType(self.target_type)

        # Ensures that target is either SINGLE, DISCRETE or CONTINUOUS before continuing
        if self._target_color_type == TargetType.AUTO or self._target_color_type == TargetType.UNKNOWN:
            raise YellowbrickValueError((
                "could not determine target color type "
                "from target='{}' to '{}'"
            ).format(self.target_type, self._target_color_type))
Currently, I have started working on updating Data Visualizer and have a PR in progress. After this, I am supposed to move on to Projection Visualizer. PR related to Projection Visualizer will be a major one. And I am eagerly waiting to work on it.