Two weeks of the coding period has ended and it is already turning into summer like never before! This blog takes you through a quick tour of my accomplishments during this period.
Developing a Yellowbrick visualizer is divided into three parts, namely, building a Visualizer API, adding unit tests and, adding proper docstring and documentation. In these two weeks, Dr. Benjamin Bengfort gave me a glimpse of how to deal with these.
Visualizer API’s
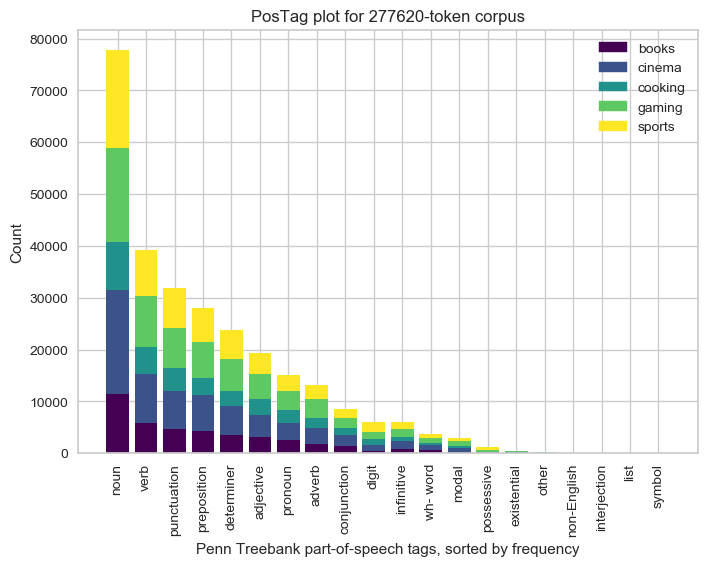
To begin with, I added a few features to PosTag visualizer. Pos in PosTag stands for part-of-speech(nouns, verbs, adjectives). A document can be Pos tagged using libraries like NLTK and Spacy. This visualizer accepts a tagged document and plots a bar chart to display the counts of each part-of-speech.
I updated the visualizer to plot PosTag frequency chart as a per-class stacked bar chart. Let us suppose that we have documents labeled as cinema, books or sports. The visualizer plot stacks based on these classes. It can help the user to compare the counts of each part-of-speech for various classes. A sample output is shown below:
These stacked bar charts are frequently used and are supposed to be a part of many upcoming visualizers. Hence we decided to add a helper function for stacked bar charts. This helper requires a two-dimensional array where each row represents a stack and each column a bar. This reduced a considerable amount of duplicated code. I went on to update the logic of helper to handle negative values here.
Testing
Testing is an essential feature of any OpenSource library. It helps the users and maintainers to have a quick peek into the outputs and ensures that the visualizer functions correctly after all the changes. What tests does a visualization library is supposed to have? Image Comparison tests! Yellowbrick wraps matplotlib’s image comparison test utility into an easy to use assert method.
I added a few tests for the features I added in PRs. The problem I came across while dealing with these tests was that Windows generates a slightly different image when text is involved. So I was supposed to remove text (labels and legends) wherever possible. This caused a lot of duplicate code in many tests, as few lines of code to remove labels and legend were repeated. But Yellowbrick community came to rescue as there was a PR(almost complete) on a feature to deal with these. The PR was focused on including text removal as one of the base features. I added many text covering almost every feature that stacked bar chart can offer. I added tests for both horizontal and vertical plots. The work related to tests was done here.
Documentation
Documentation is required to make the usage of the library easier for other users. I have not touched this part yet, but I am supposed to in the coming weeks. I have been working on a dataset and will publish a notebook to Github demonstrating usage of Yellowbrick visualizers.
Current Tasks
I am currently working on a PR to add support of stack helpers to PosTag, Class Prediction Error and, Feature importance visualizers. This PR is almost complete and requires a few tweaks. After this, I am supposed to work on unifying functionality of PCA and Manifold visualizer. They both are dimensionality reduction techniques and have quite a lot of features in common.