I have completed my work on Manifold and PCA features. PR related to Manifold was quite easy but PCA needed a bit more care. After completing this I will meer almost 85% of my GSoC targets.
Manifold Visualizer
Building Manifold Visualizer was a very easy task as most of the work was either already done or was covered in my PR related to Projection Visualizer. This visualizer got updated with new funcitonality of 3-dimensional plots. Building a transformer was a tough task which was already done for me, so I did not have much problem. All the work related to the this was done here.
The main challenges that I faced during this was to build test. Although many of the tests were already built, some of the new tests that I built gave almost a 100 lines error. After exploring this issue a bit and discussing with Dr. Benjamin Bengfort, I came to conclusion that error was due to type of data that was feeded to the visualizer. Just a few tweaks in the random state and the tests were passing. A sample test that I built during this is given below:
def test_manifold_algorithm_transform_fit(self, algorithm):
"""
Test manifold fit with algorithms having transform implemented
"""
    X, y = make_s_curve(1000, random_state=94)
    with pytest.warns(YellowbrickWarning):
        manifold = Manifold(manifold=algorithm, target="auto")
PCA Visualizer
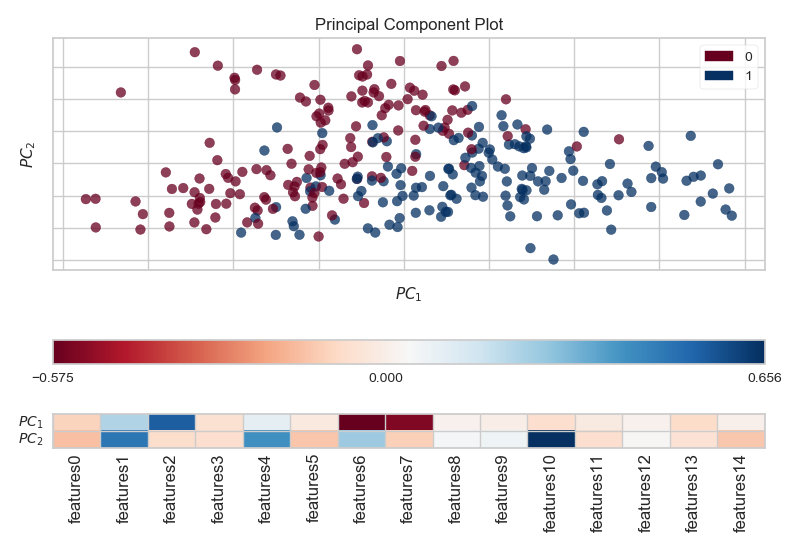
This visualizer need a bit more care to handle, as it had more complex functionality than Manifold. It had biplots and a newly implemented heatmap and colorbar which shows the importance of each feature in the Principal Components. The basic blueprint related to heatmap was built here. I was a one of the reviewer in this PR along with Dr. Rebecca Bilbro.
In my PR here, I extended the PCA visualizer to get the features of Projection Visualizer. I created a layout using Divider Axes which added new subplots to the existing plots.
The challenges that I faced in working with these were related to layout that I created. Working with layout can be tricky. I needed to call layout in the super class from the PCA, which created some anomalies and I got different outputs. Keeping a common divider for all the layout worked for me and I got things working. A sample layout function is shown below.
def layout(self, divider=None):
    """
    Creates the layout for colorbar and heatmap, adding new axes for the heatmap if necessary and modifying the aspect ratio. Does not modify the axes or the layout if ``self.heatmap`` is ``False`` or ``None``.

    Parameters
    ----------
    divider: AxesDivider
        An AxesDivider to be passed among all layout calls.
    """

    # Ensure matplotlib version compatibility
    if make_axes_locatable is None:
        raise YellowbrickValueError(
            (
                "heatmap requires matplotlib 2.0.2 or greater "
                "please upgrade matplotlib or set heatmap=False on the visualizer"
            )
        )

    # Create the new axes for the colorbar and heatmap
    if divider is None:
        divider = make_axes_locatable(self.ax)
    # Call to super class ensures that a colorbar is drawn when target is
    # continuous.
    super(PCA, self).layout(divider)
    if self.heatmap:
        # Axes for heatmap
        if self._uax is None:
            self._uax = divider.append_axes("bottom", size="20%", pad=0.7)

        # Axes for colorbar(for heatmap).
        if self._lax is None:
            self._lax = divider.append_axes("bottom", size="100%", pad=0.5)
A plot showing the new layout:
 Working with tests was quite easy in this visualizer.